Task1 Birth rate
WRITING TASK 1
You should spend about 20 minutes on this task.
The graph below compares changes in the birth rates of China and the USA between 1920 and 2000.
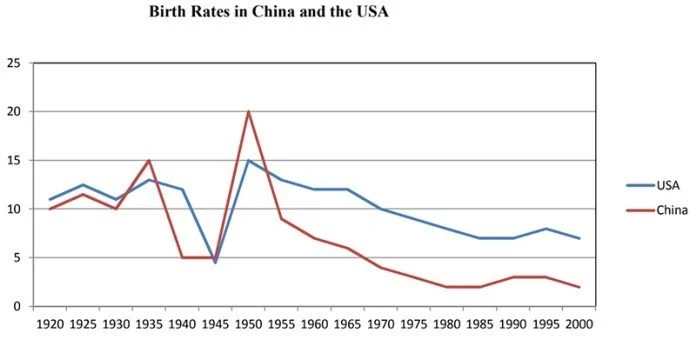
The line chart provided reveals some striking parallels between Chinese and the US birth rates during the period from 1920 to 2000. It is apparent that the two countries see considerable fluctuations in fertility.
To begin with, rising from 10 % in 1920 to 15% in 1935, China’s birth rate dives to a low of 5 percent in the 1940s, followed by a dramatic increase to 20% in 1950. Remarkably, there is a sharp decline to approximately 8% in 1955. Consequently, fertility rate in China shows a fairly decline at around 2% by 1980 before levelling off in the vicinity at the level until 2000.
Meanwhile, the U.S. birth rate fluctuates between 12% and 14% until 1940, followed by dropping precipitously to less than 5% in 1945. Over the next five years, the figure drastically soars up to the top of the period, at 15 percent. As a consequence, the rate stayed fairly declined at around 7% by 1985, before remaining unchanged till 2000.
In conclusion, although the birth rate in the USA was generally higher than that in China, both countries exhibited similar trends in their birth rates over the examined period. They experienced initial increases, followed by declines in 1940, rapid growth in 1950, and subsequent gradual declines.